Miniscope v4 - time segments statistics module
One of my repeating and little tedious job tasks is evaluating or verifying CPU usage
of some complex, multitasking system. Since functionalities I am testing usally are combining
activity of more than one thread and system is using program/data cache simple measuring
of code fragment execution time is inadequate. My method of choice is measuring CPU usage
by measuring "idle" time. To measure "idle" time additional lowest priority thread is created
which only job is pin toggling. Observing this pin state with oscilloscope allows
to distinguish moments when CPU is busy processing higher priority (all other) tasks
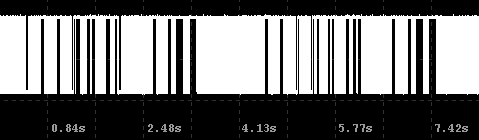
and when CPU is idle - pin is toggling with high speed (visible below as a white plot area).
Example plot contains 512 kSamples:
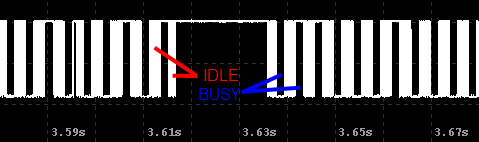
After zooming higher frequency components (tasks that are active more regularly but for a shorter period of time)
are visible:
Estimating CPU usage by particular functionality requires comparing is with CPU usage in idle state in specific system configuration. Good estimation required measuring time spans, writing it down, sum it up and calculating average value and was error prone. Statistics module is intended to speed up this calculation and minimize error chance.
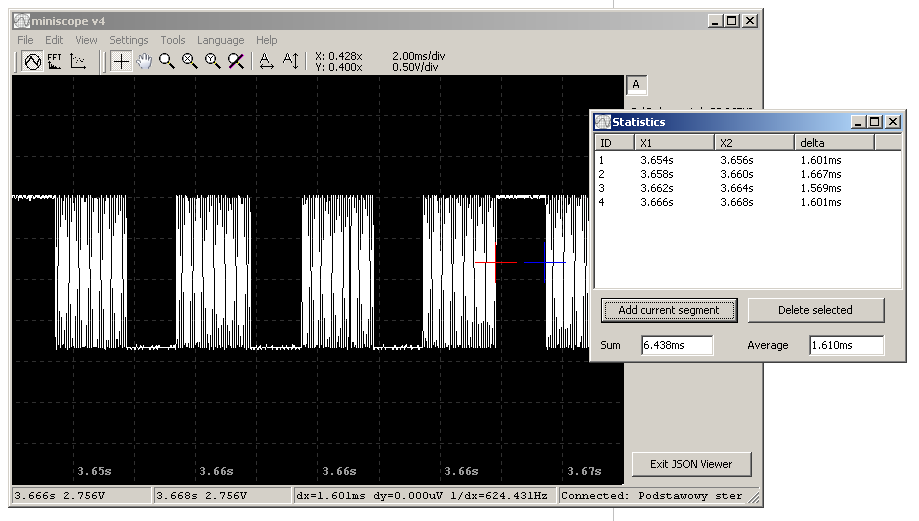
After marking interesting plot fragment with cursors its time span can be directly grabbed by statistics
window. To allow observing multiple activities or comparing with idle work multiple statistics windows
can be used at once to collect data related to different tasks/threads.
If needed statistics module can be easily extended to operate also with cursor voltage values.